Mr. Market Reveals His Secrets In 2015

What the difference between stocks and bonds are telling us about the economy in 2015?
“Luminous beings are we…not this crude matter.” – Yoda
Just how rare is it for both stocks and bonds to be down on a calendar year basis?
Extremely rare apparently!
Going back to 1928 there have only been 4 instances for an impressively small 4.5% of occurrences.
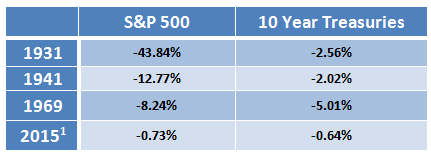
The last time we experienced this phenomenon was in 1969 the year prior to the decade that saw stagflation and the Vietnam War.
Moreover, 2015 was a much vaunted 3rd Year of a Presidential cycle where the S&P 500 had never suffered a loss since World War II2
So excuse us for asking but what went wrong?
Global Economic Slowdown Fueling Volatility
The primary reasons behind poor equity performance last year was the ongoing and deeper slowdown in China.
Agitated by draconian moves on behalf of the Chinese authorities which included a ban on short-selling, triggering circuit breakers and then abandoning them and ‘taking in for questioning’ high level executives, moves that exacerbated the drop further. Something we warned against in our February 2nd 2015 note entitled Shanghai Stock Exchange Index and The Long Game.
The horrific terror instances in Paris on 13th November 2015, the Syrian refugee crisis and the rise of ISIS is reminiscent of social unrest in the 1930s and the rise of National Socialism. Is it not eerie that the world was then as it is now going through a deflationary period?
With negative nominal policy interest rates in Switzerland, Sweden, Denmark and the European Central Bank itself, certain parts of Europe are no longer experiencing slow growth but negative growth! Financial hardship follows, a breeding ground for social unrest.
Poor Mario Draghi the ECB President has presided over €60 billion Bond purchases a month since March 2015 only to find it is NOT enough and on October 22nd promised the market more. Heavens! Private lending has been picking up in Europe but just not quick enough.
Viewing events on a continuum helps to understand what may happen next
This bull market began in March 2009 as global equity markets bottomed from their 2008 epic financial crisis. At 81 months it is now the 2nd longest bull market in history with the average being 58.
Trillions of Dollars of stimulus have been injected into the global economy since. The old adage is that central banks can create money out of thin air but they cannot dictate where it will flow to.
We have seen potential asset bubbles forming in energy (now collapsed) and venture capital. Private companies which sport valuations north of $1 billion have become known as Unicorns and include names such as Uber and Airbnb.
But stimulus has also postponed the cleansing of credit system.
Stansberry research published an interesting research piece on credit cycles where they noted that the 1990-1993 recession saw defaults on high yield bonds peaking at 11% or $50b, the 2000-2002 recession peak defaults were 8.7% but the amount of capital was commensurately larger at $500b (10x). Fast forward 2008-2010, defaults rose to a peak of 10% featuring Trillions of Dollars in credit yet only $1 trillion went into default. The point – the debt burden is growing exponentially but bad debts were not cleansed fully during the 2008-2010 recession and hence the system became water-logged.
A water-logged system is one where future growth is difficult because you are still servicing your ‘dead’ liabilities from the past.
One uncleansed misallocation of capital was Chinese Real Estate – the now infamous Ghost Cities. The slowdown in construction admittedly slow to hit the headlines finally arrived and it was no surprise to us that China would feel further pain. The dominoes have been falling:
- First in line were raw materials whose demand and prices have dropped precipitously as Chinese construction slowed.
- As that glacier moved (at glacier pace) slower revenues began to impact the underlying collateral of Commodity based countries who saw currency devaluations;
- Acute pain was felt in emerging markets particularity those who had gorged on issuing Dollar denominated Emerging Sovereign Debt and whose liabilities became bigger as the Dollar rallied;
- Energy and Resource companies saw large selloffs. The poster child, Glencore, was down 67% on the year as they faced the prospect of a debt downgrade to junk.
- High Yield fell initially as Energy credits repriced lower but then overall credit concerns caused spreads to widen.
- The Euro and European markets moved lower as negative interest rates caused the currency to weaken and poor growth prospects combined with insufficient stimulus knocked equities down.
- The standout winners for 2015 in what became the narrowest of rallies goes to the FANG’s – Facebook (+34%) , Amazon (+117%) , Netflix (+134%) and Google (+47%). Just how narrow was the rally? This quote from The Fred Repot is striking:”Through this past Friday December 11th, there are 2,154 stocks higher for the year and 4,587 lower with 64 stocks with no change. That means only 31.65% of stocks are higher year to date through last Friday. Of the stocks that are lower year to date, 1,413 are down between -0.10% and -9.90%. Meanwhile there are 3,169 names down more than -10%. Even more telling is that 1,889 names are down more than -25% for the year.”
Is there a pending Pension Fund Crisis?
We pondered the effects of negative returns from both bonds and stocks on a most important area of our capital base – defined benefit pension plans. It is clear to see that when both stocks and bonds are lower it is even harder to achieve the actuarial rate of return of 6-8% going forward. The unfunded liabilities amount to what we perceive as a pending pension crisis.
Anecdotally we expect pension boards to continue seeking returns from alternative investments, despite their lackluster performance. And we expect this to be an area of tremendous capital inflows –primarily low volatility arbitrage type strategies in 2016 and beyond.
In addition, we expect to see more money from operating budgets (municipal as well as corporate) channeled into the pension black hole which of course crimps local government spending and corporate profits going forward.
However, after numerous false alarms, the Federal Reserve finally raised short-term interest rates by 0.25% on December 16th – citing the ongoing strength in the labor market — the first hike in 7 years.
Savers including Pension funds finally got a minor reprieve and we wonder if the Fed was prompted to raise because of a pending pension fund disaster?
2016 could be the year of Higher Interest Rates
As of this writing the world looks to be in the grips of a deflation as Oil continues to careen down to $30 and the deflationist crescendo is getting louder.
We do not hear of anyone asking about all those Trillions of Dollars that were created through stimulus programs that sit on bank balance sheets waiting to move into the economy.
As noted in our 2016 Forecast a big surprise could be in store, for the second half of the year, if inflation unexpectedly emerges.
Truthfully we are not sure where it could come from but we note that the inflation bar is set very low and markets have a nasty habit of obfuscating the consensus view. And we do find it eerie that the last down year for both stocks and bonds was prior to the last inflation outbreak in the 1970s.
Ultimately we think the positive trend in ADP non-farm payrolls and lower unemployment rate – currently at 5% – continues. We noted with interest the leap in minimum wage increases in January 2016 up 38% from $7.25 to $10 and in some instances $153 (San Francisco, Seattle).
The risk is that Jane Yellen may, surprisingly, face consumer prices rising more than the 2% target – believe it or not. Causing the Fed to raise interest rates, shifting the entire yield curve higher despite a slowing global economy. The worst of all worlds in our opinion.
We have a forecast of 3.0% on the 10 Year U.S. Treasury note currently at 2.1% on 1/13/2016.
We can’t help but wonder if the Bond market is sensing this and why Bonds did not rally in 2015 (and early 2016) in what was seemingly perfect conditions for lower interest rates.
We remain honored and proud to be stewards of your hard earned capital
Greg Silberman
Chief Investment Officer
—
Thank you for reading my post. Please sign up for our newsletter which contains private investment opportunities and other great information.
Nothing in this article should be interpreted as a recommendation to buy any security. Please consult your financial advisor & conduct your own due diligence.
Sources:
- stockcharts.com – excludes dividends and coupons
- 1937 was last time S&P500 was down in 3rdyear of presidential cycle –https://money.cnn.com/2015/01/07/investing/stocks-markets-worst-start-since-2008/
- Minimum wage 2016 – https://money.cnn.com/2015/12/23/pf/minimum-wage-2016/
- Main pic: https://picography.co/photos/reflecting/